There’s plenty to keep track of when running a product-based business, most notably the management of inventory and everything that comes along with it (from purchasing and ordering to your supply chain). To do this well, business owners and executives often turn to standard inventory ratios and formulas to stay organized and keep things running smoothly. Relying on formulas and ratios to tell the story of your inventory management can help elevate performance and better target revenue goals.
What are inventory formulas and ratios and why do I need them?
Inventory management is complex. By adopting ratios for inventory management and supply chain, you’ll be able to better analyze benchmarks and key performance indicators, such as sales performance and product turnover. In addition, you’ll have a more accurate way to monitor the growth of your business and areas of opportunity along the way. To benefit from this level of standardization, plan to implement common inventory ratios like inventory turnover, cost of goods sold, and days’ sale average.
Get familiar with these 6 essential inventory ratios and formulas:
Inventory turnover ratio formula
Inventory turnover, also called stock turn, signifies how often a specific product is sold and replaced in a period of time. Depending on the product, the time period could be anywhere from a calendar year or a season to weekly (for items like fresh food).
Calculating stock turn is significant because it clarifies whether individual products are profitable for your business. It’s also a clear indicator of which products have weak sales performance, as well as whether your purchasing levels are on target.
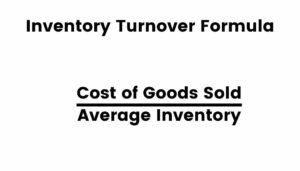
Inventory turnover formula: divide sales (cost of goods sold) by inventory (average inventory) for a specific time period.
Sales ÷ Inventory = Inventory Turnover Ratio
Cost of goods sold formula
The cost of goods sold formula clarifies the value of your inventory, and it’s useful for several other important inventory formulas as well. It’s also critical data for your yearly tax filing, since it reduces your taxable business income.
Depending on how many products your business sells and how involved the manufacturing process is for those products, sometimes this formula can be complex. As a starting point, use the calculation below.
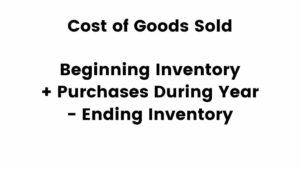
Cost of goods sold formula: Add the cost of inventory at the beginning of the year to any additional inventory costs, and then subtract the cost of inventory at the end of the year.
(Cost of Beginning – Year Inventory + Additional Inventory Costs) – Cost of End-Year Inventory = Cost of Goods Sold
Average inventory formula
Average inventory is the second key piece of information needed to complete the inventory turnover formula. When calculating this inventory equation, first decide which time period you’ll use to determine your average. Most often, average inventory is calculated by month, in which case, you’ll divide by 2. For a season, divide by 7. For an entire year, divide by 13.
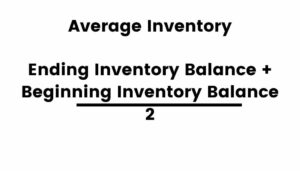
Average inventory formula: Take your beginning inventory for a given period of time (usually a month). Add that number to your end of period inventory (month, season, or year), and then divide by 2 (or 7, 13, etc).
(Beginning of Month Inventory + End of Month Inventory) ÷ 2 = Average Inventory (Month)
Experience the simplest inventory management software.
Are you ready to transform how your business does inventory?
Sell-through rate inventory formula
 Understanding your sell-through rate is an important part of your supply chain and is useful when assessing your purchasing and ordering process. In addition, it’s a key inventory equation in determining how well your inventory is translating into sales for your business.
Sell-through rate formula: Start with the number of units sold and divide by the number of units received. The result is signified by a percentage.
Units Sold ÷ Units Received = Sell-Through (%)
Days’ sale inventory formula
The days’ sale ratio calculates the average number of days it takes to move a product. Typically, business decision makers want this KPI to be low, as it indicates inventory is selling quickly. Like the sell-through rate and other formulas mentioned here, this number can help you manage your purchasing process.
For this formula, you’ll need to know your industry turnover ratio.
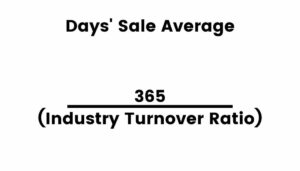
Days’ sale formula: Divide 365 (the number of days in a year) by your industry turnover ratio. The result is your days’ sale average.
365 ÷ [Industry Turnover Ratio] = Days’ Sale Average
If you don’t know your industry turnover ratio, you can use an alternate calculation: Multiple your cost of goods sold by 365, then divide your inventory by that number.
Ending inventory formula
Ending inventory, also known as closing stock, is a useful way to understand how much of a product is available at the end of a specific time period. It’s also a key metric in determining a business’s financial status. There are a few different inventory valuation methods you might use for calculating this figure, including first in first out, last in first out, or weighted average. Once you determine your inventory total using one of these methods, use the calculation below:
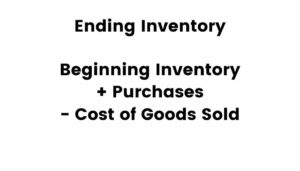
Ending inventory formula: Add beginning inventory value to purchases, then subtract the cost of goods sold.
(Beginning Inventory + Purchases) – Cost of Goods Sold = Ending Inventory
Average stock level inventory formula
Average stock level can help you understand what your business normally has in stock, as compared to what you carry at three other main stock levels: minimum, maximum, and danger.
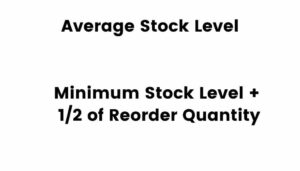
Average stock level formula: Determine your minimum stock level, then add half of your reorder quantity. Your minimum level is the amount of inventory you must maintain at all times to avoid a work stoppage.
Minimum Stock Level + 1/2 Reorder Quantity = Average Stock Level
How inventory management software can help
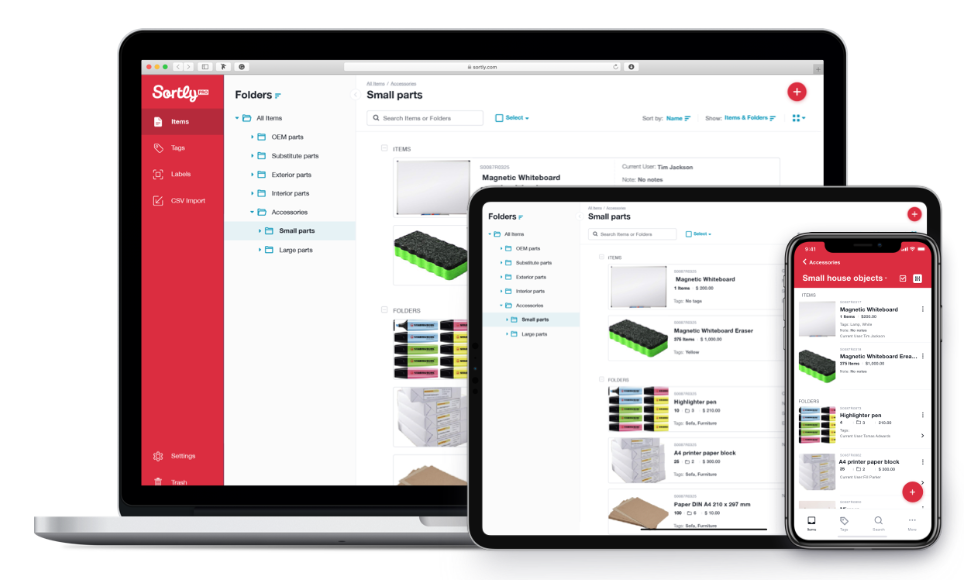
Sortly is an inventory management solution that helps you track, manage, and organize your inventory—from any device, in any location. We’re an easy-to-use inventory software that’s perfect for small businesses. Sortly builds inventory tracking seamlessly into your workday so you can save time and money, satisfy your customers, and help your business succeed.
With Sortly, you can track inventory, supplies, parts, tools, assets like equipment and machinery, and anything else that matters to your business. It comes equipped with smart features like barcoding & QR coding, low stock alerts, customizable folders, data-rich reporting, and much more. Best of all, you can update inventory right from your smartphone, whether you’re on the job, in the warehouse, or on the go.
Whether you’re just getting started with inventory management or you’re an expert looking for a more efficient solution, we can transform how your company manages inventory—so you can focus on building your business. That’s why over 15,000 businesses globally trust us as their inventory management solution.
Start your two-week free trial of Sortly today.