
Inventory analysis is the process of evaluating inventory data to improve stock control, reduce waste, and support smarter decision-making. Whether you’re managing construction tools across job sites or tracking everyday office supplies in a stockroom, inventory analysis helps you understand what you have, what you need, and how to optimize your operations.
This guide covers key analysis methods, performance metrics, and implementation tips. It also touches on how the right inventory management technology can simplify this process as your business scales.
What is inventory analysis?
Inventory analysis involves reviewing inventory data to assess stock levels, movement patterns, and overall performance. It helps businesses identify inefficiencies, forecast demand, and make informed decisions about procurement, replenishment, and inventory control.
For example, a construction company might use inventory analysis to track tool usage across job sites. A medical lab might analyze expiration dates and reorder points to stay compliant and avoid waste.
What is inventory analysis?
What are the benefits of inventory analysis?
Effective inventory analysis supports better decision-making across the supply chain. It helps reduce stockouts and overstocking, improves cash flow, and increases profitability by aligning inventory levels with customer demand.
Some of the key benefits include:
- Fewer stockouts and backorders: Forecasting demand more accurately helps maintain safety stock and avoid delays in order fulfillment.
- Improved cash flow: Reducing excess inventory frees up cash that can be reinvested elsewhere in the business.
- Higher customer satisfaction: Meeting demand consistently builds trust and loyalty, especially in industries like retail and ecommerce.
The importance of multi-location inventory analysis
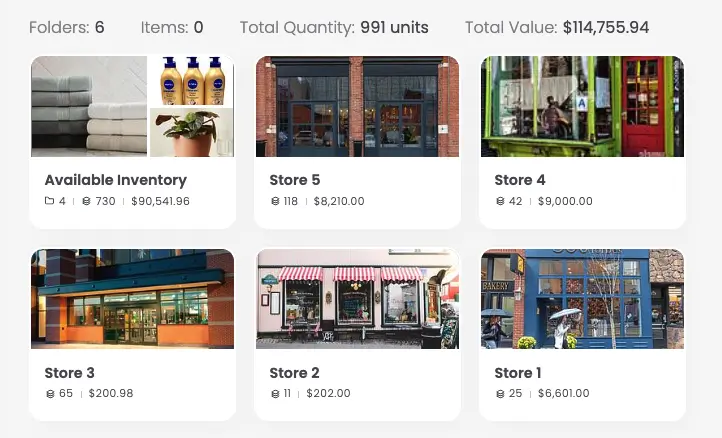
For businesses with multiple warehouses, job sites, or retail locations, inventory analysis is essential for maintaining balance across locations. It ensures that stock is distributed efficiently, prevents duplicate orders, and supports real-time visibility into inventory levels.
If one location is overstocked while another is running low, inventory analysis helps identify that fact and enables timely transfers before it impacts the business.
5 essential methods for analyzing inventory data
Each of the following five methods offers a different lens for evaluating inventory items based on value, demand, or movement.
1. ABC Analysis
ABC analysis classifies inventory into three categories, prioritizing those that are stocked in small amounts and generate the most profit or are worth the most.
- A: High-value, low-quantity items (e.g., expensive tools or equipment)
- B: Moderate-value, moderate-quantity items (e.g., mid-range supplies)
- C: Low-value, high-quantity items (e.g., disposable gloves or fasteners)
This method helps prioritize inventory control efforts by focusing attention on the items that have the biggest impact on cash flow and profitability.
2. VED Analysis
VED analysis is used primarily in healthcare and manufacturing. VED stands for:
- V (Vital): Items that are critical to operations and must always be in stock (e.g., emergency medical supplies)
- E (Essential): Items that are important but not immediately critical (e.g., lab reagents)
- D (Desirable): Items that are useful but not essential (e.g., promotional materials)
VED analysis supports procurement decisions and ensures critical items are always available, especially in regulated or high-risk environments.
3. EOQ (Economic Order Quantity)
EOQ calculates the ideal order quantity that minimizes carrying costs and ordering costs. For example, ordering too frequently increases administrative costs, while ordering too much ties up cash and increases storage expenses.
EOQ helps streamline procurement and reduce excess inventory by identifying the most cost-effective reorder quantity.
4. FSN Analysis
FSN analysis categorizes items based on movement. FSN stands for:
- F (Fast-moving): Items used or sold frequently (e.g., daily-use tools)
- S (Slow-moving): Items that move less frequently (e.g., seasonal supplies)
- N (Non-moving): Items that haven’t moved in a long time (e.g., obsolete parts)
FSN analysis helps identify slow-moving or obsolete stock that may be tying up space and capital.
5. SDE Analysis
SDE analysis groups items by availability. SDE stands for:
- S (Scarce): Items that are hard to procure or have long lead times
- D (Difficult): Items that are available but require effort to source
- E (Easily available): Items that are readily available from multiple suppliers
This method supports sourcing strategies and helps mitigate supply chain risks by identifying which items require more proactive planning.

Critical metrics and KPIs to measure inventory performance
Tracking the right metrics is key to understanding how well your inventory is performing and where to improve. These KPIs help you measure efficiency, cost, and responsiveness.
Inventory turnover ratios and velocity metrics
- Inventory turnover ratio = Cost of goods sold ÷ Average inventory
- A higher ratio indicates efficient inventory movement. A lower ratio may signal overstocking or slow-moving items.
- Velocity metrics track how quickly items move through the system, helping you identify bottlenecks or excess stock.
Monitor these monthly or quarterly to assess efficiency and avoid tying up capital in stagnant inventory.
Stock optimization and carrying cost metrics
- Carrying costs include storage, insurance, depreciation, and opportunity costs. For example, storing excess raw materials may increase warehouse costs and reduce available space.
- Reorder points help maintain safety stock without tying up cash. These are calculated based on lead time and average demand.
Review these metrics often—quarterly is standard—to optimize your balance sheet while avoiding overstocking or stockouts.
Demand forecasting accuracy metrics
- Compare forecasted demand to actual usage to identify gaps in your planning process.
- Track forecast error rates to improve procurement and reduce lost sales.
Evaluate these monthly to refine forecasting models and keep your business running smoothly and without interruption, especially in fast-moving or seasonal industries.
How technology simplifies inventory analysis at scale
Modern inventory management systems like Sortly automate data collection and reporting, making analysis faster and more accurate. Sortly’s smart features not only ensure you have the right data, but also enable you to take data-driven actions right from the app. For instance:
- Customizable inventory reports aggregate all of your inventory data in one place to help you spot patterns, track usage, and calculate profitability.
- Barcode and QR scanning allow your team to make faster inventory updates and fewer manual errors.
- Low stock alerts help you prevent stockouts before they happen.
- Real-time inventory tracking across locations ensures you have a complete, real-time understanding of how much inventory you’re carrying.
Emerging technologies like machine learning also support predictive forecasting and real-time analytics. For example, predictive models may be able to flag when a frequently used item is trending toward a stockout before it impacts operations.
This easy, comprehensive guide will help you: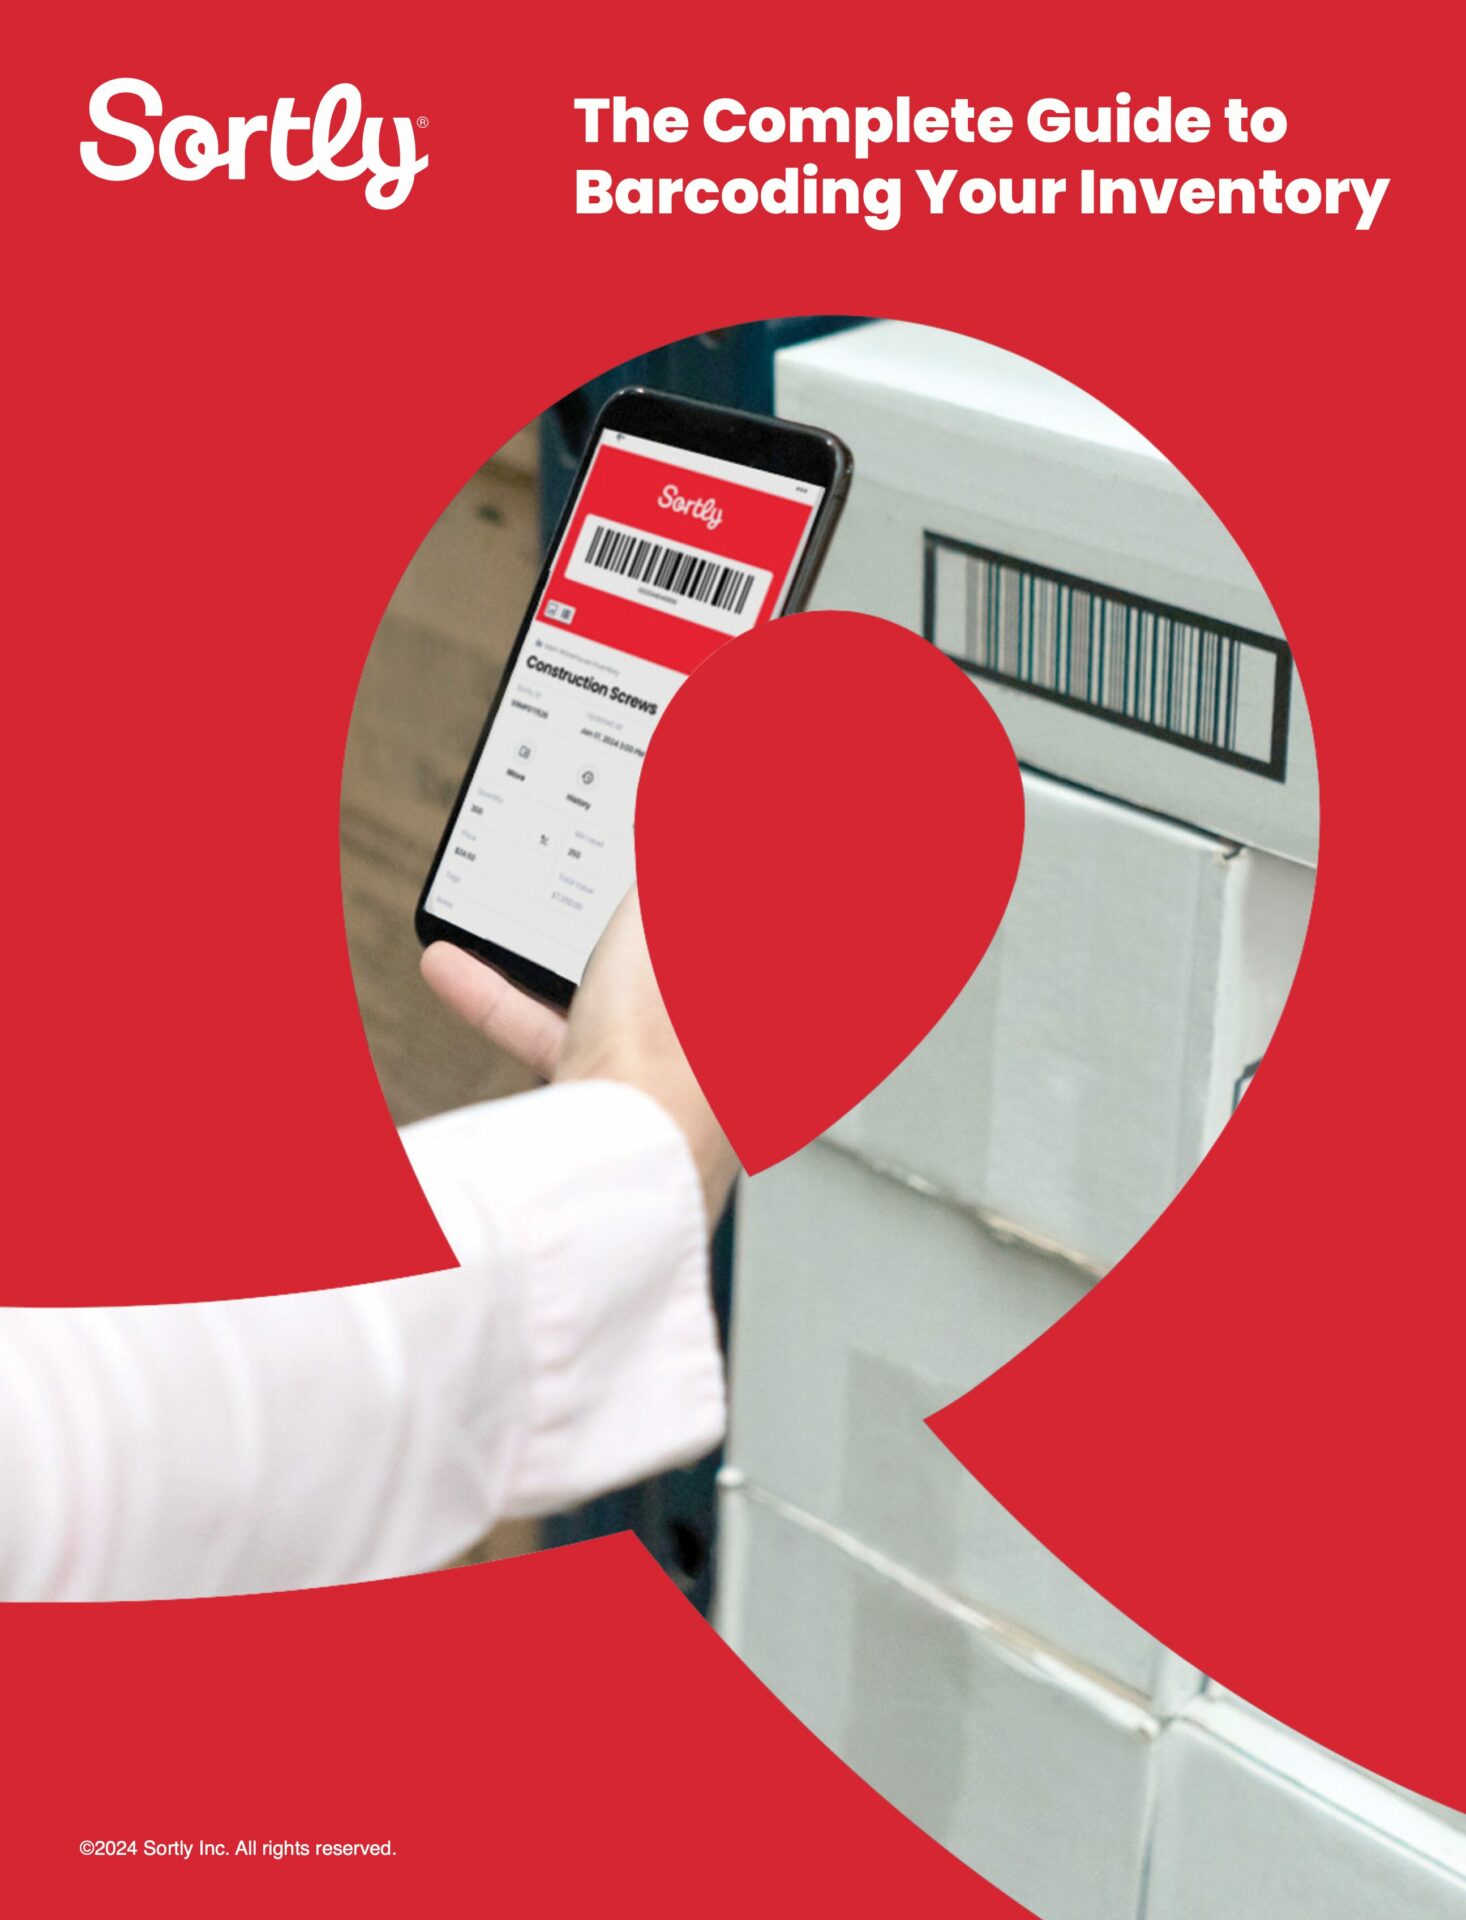
Free Ebook: The Complete Guide to Barcoding Your Inventory
Tips for implementing inventory analysis solutions
To get the most value from inventory analysis, consider these best practices:
- Ensure multi-team alignment between operations, finance, and procurement. In other words, get all your departments on the same page regarding inventory, and make sure purchasing decisions reflect both budget constraints and real-time inventory numbers.
- Set up data quality and validation procedures to ensure accurate inventory data. This includes regular cycle counts, barcode scanning, and user training. All of this should be outlined in a standard operating procedure.
- Make changes to your strategy to support user adoption and long-term success. This might involve onboarding sessions, internal documentation, updating the SOP quarterly, or assigning inventory “team leaders” across departments.
See how simple inventory analysis can be with Sortly
Inventory analysis doesn’t have to be complicated. With Sortly, you can track inventory in real time, generate detailed reports, and make smarter decisions with accurate data. Whether you’re managing raw materials, finished goods, or tools across job sites, Sortly helps you streamline inventory control and improve profitability.
Start your two-week free trial of Sortly today.